


三維(3D)光柵建模教程 
如何選擇衍射級數目?新建參數遍歷(New Parameter Run),將衍射級數目設置為變量,逐步增加衍射級數目,使用光柵衍射效率分析器(Grating Efficiency Analyzer)確定要獲得真實可信的結果(衍射效率達到收斂時)所需要用到的衍射級數目。
3418 6 2
追光ing ??? 2年前
批量提取Abaqus的節點坐標(初始坐標、指定Step下的變形量、變形后節點坐標) 
<h2>摘要</h2><p>本文介紹如何使用Python腳本二次開發來批量提取ABAQUS輸出數據庫(ODB)文件中指定Step下的Set節點集變形量。通過詳細的步驟說明、代碼示例和圖片展示,您將學會如何使用該腳本,自動化輸出CSV文件包含(Node Label;Step Name、Increment、Step Time,U1,U2)。
7383 5
邁阿密Coffee ??? 2年前
批量提取Abaqus指定Step-x下 Set節點集的反力RF(Reaction force) 
在腳本中,設置待處理的ODB文件放置目錄。</p><p>2. 在腳本中,設置要提取的步驟名稱`step_name`和節點集名稱`set_name`。</p><p>3. 在腳本中,設置一下保存的文件名稱。
4179 3 3
邁阿密Coffee ??? 1年前
[VirtualLab] 非序列追跡的通道設置 ![[VirtualLab] 非序列追跡的通道設置](https://q6.itc.cn/images01/20260417/08e96297c9534c56a6f316af40c35603.png)
? 不同的通道設置會導致不同的建模方案。要更改“常規光學設置”中元件的通道,請將主菜單中的“Light Path Finder”部分的設置更改為“手動配置”。要更改“常規光學設置”中元件的通道,請將主菜單中的“Light Path Finder”部分的設置更改為“手動配置”。
698
信光嗎 ??? 1月前
VirtualLab:非序列追跡的通道設置 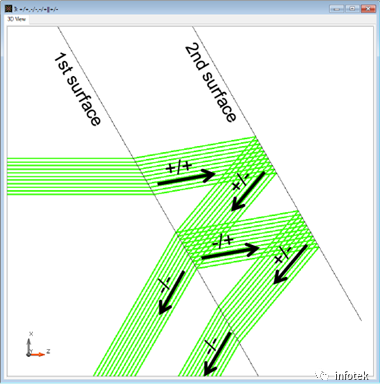
不同的通道設置會導致不同的建模方案。 要更改“常規光學設置”中元件的通道,請將主菜單中的“Light Path Finder”部分的設置更改為“手動配置”。要更改“常規光學設置”中元件的通道,請將主菜單中的“Light Path Finder”部分的設置更改為“手動配置”。
2371
追光ing ??? 1年前
VirtualLab Fusion全局選項中的性能設置 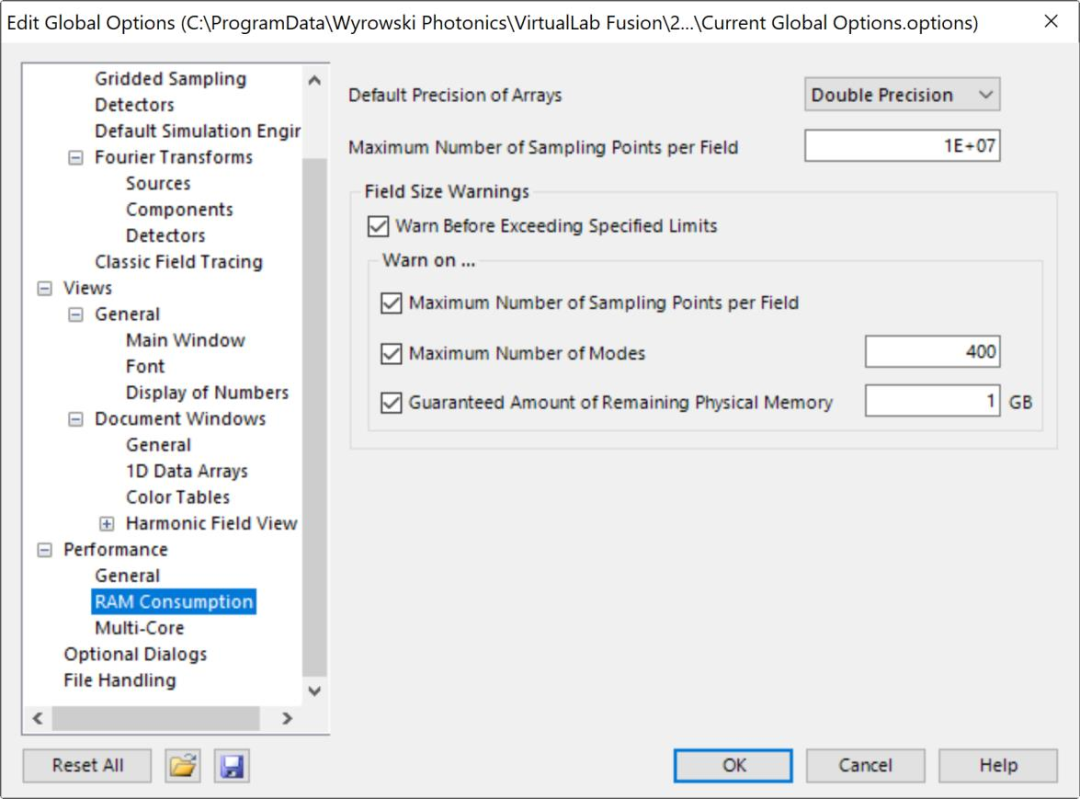
調整軟件的內部數值參數,例如每個場允許的最大采樣點數或用于計算的內核數,有助于優化與可用處理器能力和內存相關的數值負載。 在本文檔中,我們討論了可以在 VirtualLab Fusion 的全局選項中配置的與性能相關的選項。 如何訪問全局選項導航到屏幕左上角的菜單,然后導航到全局選項。
2089
追光ing ??? 9月前
Abaqus&Paraview夢幻聯動!(Python二次開發篇) 
,本次想要分享的是如何將Abaqus產生的odb文件轉入Paraview中進行后處理顯示?
4460 17 5
易公子 ??? 2年前
VirtualLab Fusion全局選項中的性能設置 
如何訪問全局選項 導航到屏幕左上角的菜單,然后導航到全局選項。
1341
信光嗎 ??? 9月前
非序列追跡的通道設置 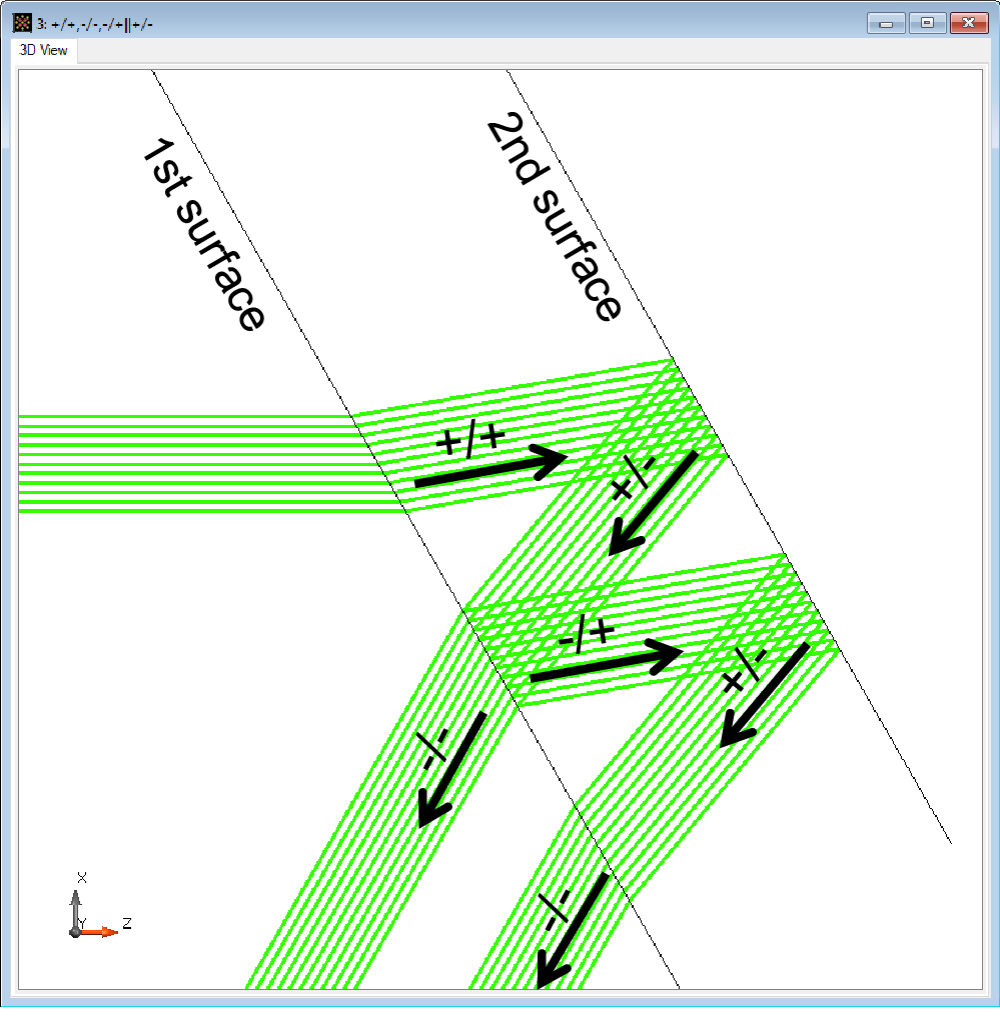
顯示了由不同的設置組合產生的光路結果。此外,我們還在光波導表面上添加了光柵區域,并演示了這些區域的通道配置,以及這些區域的光柵參數。建模任務 如何調整表面上的通道和表面上的任何可能的光柵區域,以及如何用這些設置來控制仿真。表面通道初始化l使用兩個平面表面創建一個由熔融石英制成的、厚度為5 mm的平面光波導。
1485
追光ing ??? 12月前
Fidelity Pointwise網格劃分軟件簡單使用 
Grid->Distrubution設置connector上的點的分布,Spacing欄目下設置兩端的第一個的點的位置(選中某端會顯示為白色箭頭);Function欄目用來設置點的數量和增長率,若兩端都想設置點數和增長率,要在Spacing欄目中將兩端的位置都設置好,Begin一般選擇“Number of Layers and Growth Rate”,Middle一般選擇“Tanh Using
5164 3
Fidelity CFD ??? 3年前
Cadence CFD(原NUMECA)前處理常見問答匯總(持續更新ing) 
通過更改網格拓撲,您的意思是更改我的.geomTurbo文件中吸力側和壓力側的點數,或者有沒有辦法在軟件中調整吸力側和壓力側的層數?A:是的,在Autogrid中,您可以使用B2B網格拓撲控件來查看ss/ps上的點數。有幾個選項可以嘗試:禁用“高交錯”,禁用“喉嚨中的點數”是最突出的。
3662 4 1
Cadence CFD學習 ??? 3年前
如何將圖像轉換為幾何模型 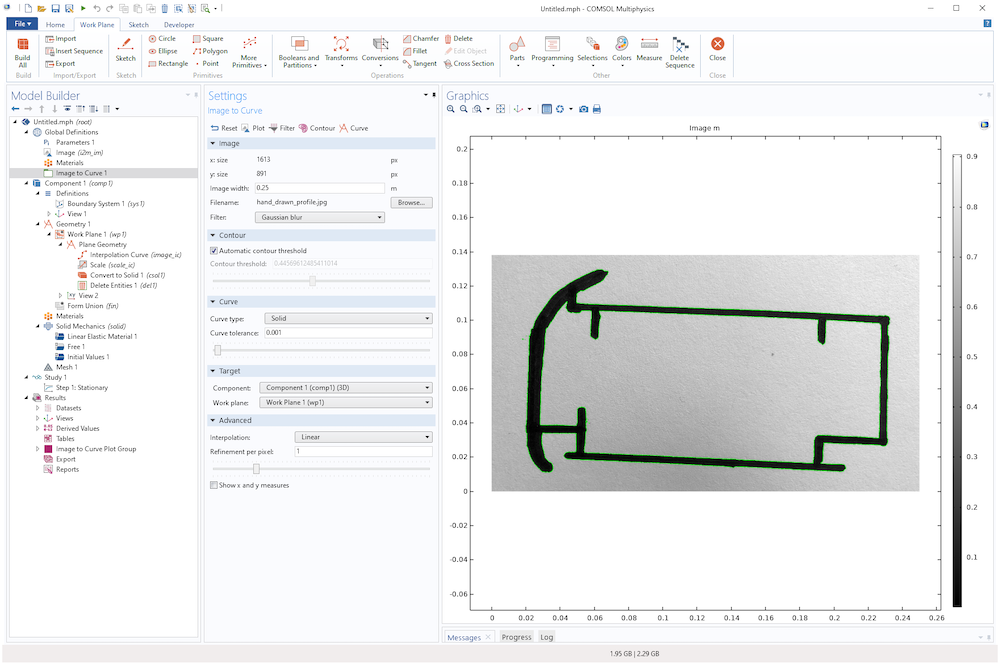
逐像素細化設置確定用于表示圖像的每個像素的網格單元數:小于1.0的值表示用于表征圖像的網格插值點數少于圖像中的像素數,大于 1.0 的值表示網格將對圖像進行過采樣。高級欄 顯示 x 和 y 度量復選框可以控制是否顯示輪廓曲線的尺寸。 輪廓線尺寸的標注。
2973 2
仿真客 ??? 2年前
車載以太網之SOME/IP-SD專題篇 
,那么也就意味著接下來就要知道如何將這些打包的SD報文發送出去以及如何接收并解析這些SD報文,接下來我們就來了解下SD Message 的發送與接收流程。
2950
駕駛哥 ??? 4年前
新一代光學工程仿真軟件—FRED MPC支持的功能 
有關GPU如何表示每種材料類型的詳細信息,請參閱本文檔的“材料”部分。3. 無論光源中的實際設置如何,功率單位始終為瓦特。 例如,如果指定50流明的光源,則GPU將產生具有50瓦特總功率的光線。 光線將被正確追跡,但50流明光源的輻射測量是不正確的。4. 如果支持位置/方向組合,仍將生成光線,但光線將不具有與偏振相關的任何屬性。
2688
追光ing ??? 1年前
【LSDYNA操作小技巧五】LSDYNA后處理數據導出設置 
那么問題來了,為了保證仿真參數設置的一致性,在做多組仿真模型時,我們不改變時間步和仿真時間,但需要只輸出50組或者20組甚至只要10組數據點怎么辦?同時輸出的數據點還需要設成0.1,不是0.05了。這樣的操作如何設置呢?這就需要設置數據數據導出的設置了,具體的操作步驟如下所示:
6718 9 7
程蔚 ??? 4年前
VirtualLab矩形組合光柵建模 
(1)(2)(3)圖14:使用VirtualLab光柵工具箱進行建模步驟13)示意圖 14) 在光路流程圖(Light Path Diagram)中添加元件內部場分析器(Field Inside Component Analyzer: FMM)進行內部場分析:參數設置如圖15(1)(2),結果圖為(3)(4) (1)(2)
2673 5 2
追光ing ??? 3年前
Ansys Zemax | 如何使用 Zenike 系數對黑盒光學系統進行建模 
$ = $PATHNAME() # save the data in the same location as the file we are using
file$ = path$ + "\" + output$
PRINT "Writing data to ", file$
(請注意,采樣和最大 Zernike 項應設置為您用于上述 Zernike 分析的值。
2581
宇熠科技 ??? 12月前
Ansys Zemax | 如何使用 Zenike 系數對黑盒光學系統進行建模 
$ = $PATHNAME() # save the data in the same location as the file we are usingfile$ = path$ + “\” + output$PRINT “Writing data to “, file$ (請注意,采樣和最大 Zernike 項應設置為您用于上述 Zernike 分析的值。
2170 1
宇熠科技 ??? 3年前
如何將三菱PLC程序轉換成歐姆龍PLC程序 
第二步:點擊設定之后,會彈出設備類型設置的對話框,我們選擇CPU類型,比如N40,即PLC的點數,設置好之后點擊確定。第三步:將程序粘貼到歐姆龍PLC軟件中在打開的軟件界面中,點擊一下梯形圖編輯區,然后進行粘貼,按下Ctrl+V快捷鍵即可,接著會彈出如下窗口,我們選擇被轉換的PLC型號,比如FX3Series。
2423
技成電工課堂 ??? 3年前
Ansys Zemax | NSC 非序列矢高圖用戶分析 
本文介紹如何使用 NSC 矢高圖用戶分析功能在非序列模式下測量和顯示對象的矢高。了解此功能的基礎知識,包括如何設置復雜 CAD 零件的文件以獲取特定面的矢高值。(聯系我們獲取文章附件) 介紹 OptocStudio 的序列模式具有表面矢高分析功能,該功能將表面從局部頂點的矢高或 z 位置變化顯示為表面上 x 和 y 位置的函數。
2295
宇熠科技 ??? 2年前
20條/頁 
跳至頁


技術鄰APP
工程師必備
工程師必備
- 項目客服
- 培訓客服
- 平臺客服
TOP
